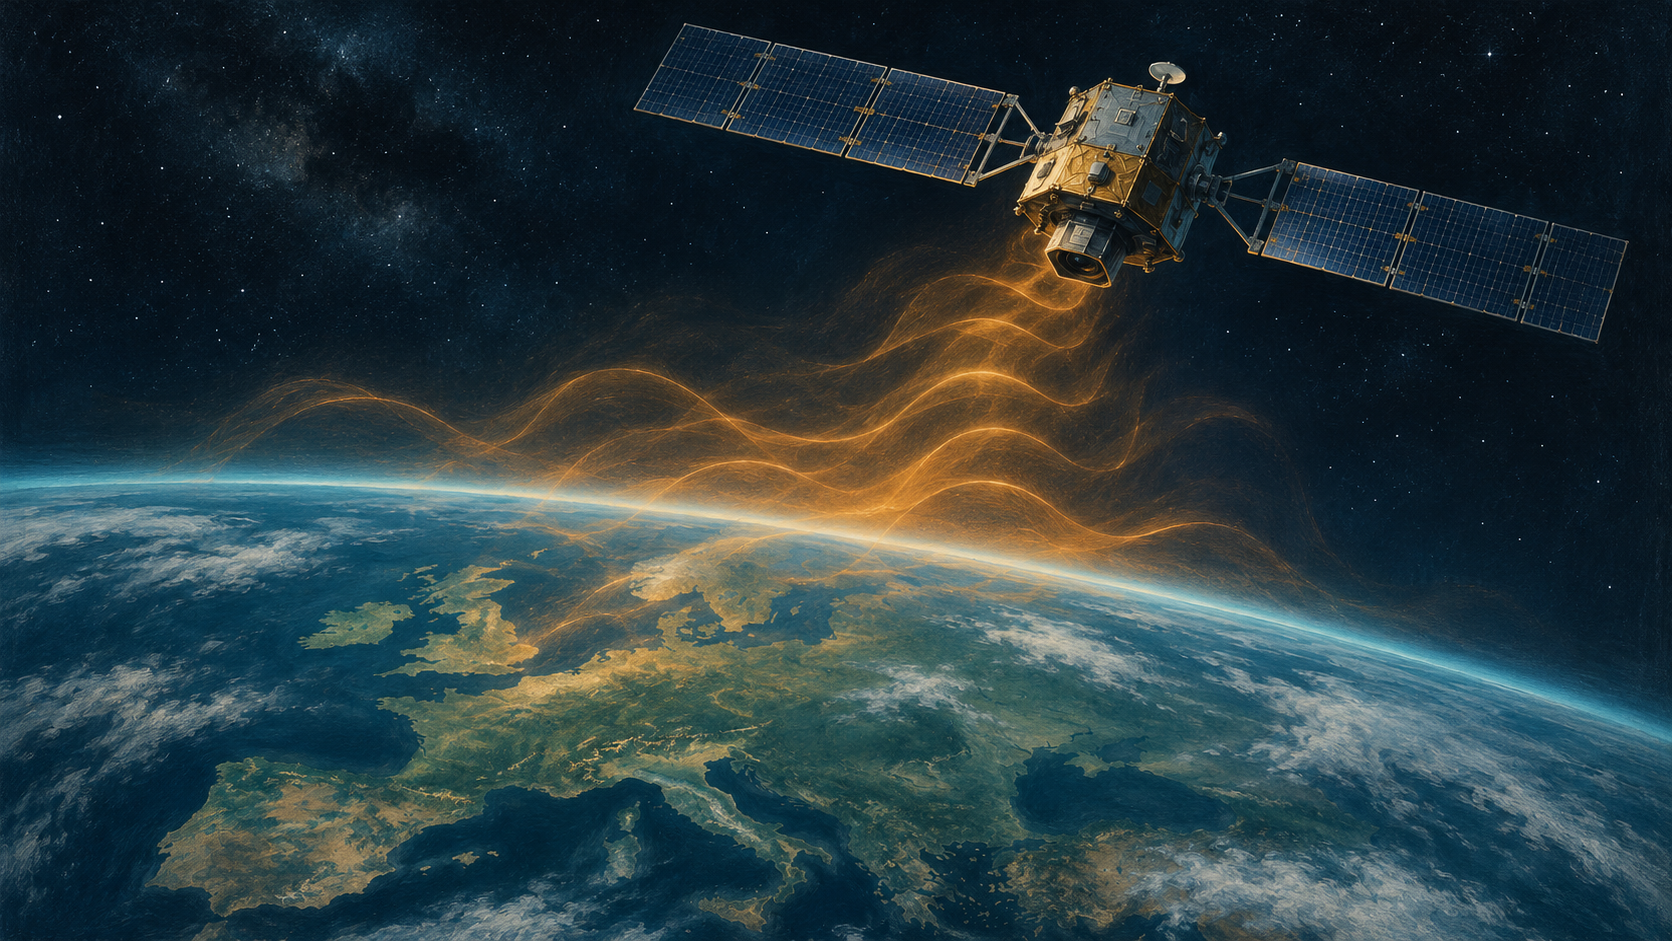
A satellite can be hundreds of kilometers above Earth and still depend on a faint radio signal to know exactly where it is. That creates an unexpected vulnerability: interference rising from the ground can reach the navigation receiver aboard a spacecraft.
Researchers at the Technical University of Denmark report that GNSS interference over Europe is affecting satellites in low Earth orbit. Their public SAT-JAM map makes reception problems visible, adding an orbital perspective to an issue more commonly associated with aircraft and ships.
The finding concerns spacecraft receiving navigation signals. It does not mean the GPS constellation has been switched off. Understanding that distinction reveals both the importance of the research and the limits of what a colorful interference map can tell us.
Satellites use other satellites to navigate
GPS belongs to a broader family of Global Navigation Satellite Systems, or GNSS, which also includes Europe’s Galileo. The navigation satellites broadcast signals that receivers use to determine position and time.
Some of those receivers are themselves in space. Earth-observation satellites in much lower orbits use navigation signals from above to determine where they are as they collect measurements and images.
This creates two different roles: a navigation satellite transmitting a signal, and a lower-orbit spacecraft receiving it. Interference can disturb the second without disabling the first.
The distinction is similar to a radio station continuing to broadcast while a listener struggles to hear it through nearby noise. The problem is real at the receiving end, even though the transmitter remains available to other users.
DTU’s explanation places many of the receiving spacecraft roughly 400–600 kilometers above Earth. The signals they receive are already faint. Strong unwanted radio energy can overwhelm reception, and the relatively clear path between the ground and an overhead spacecraft allows interference to reach well beyond ordinary surface obstacles.
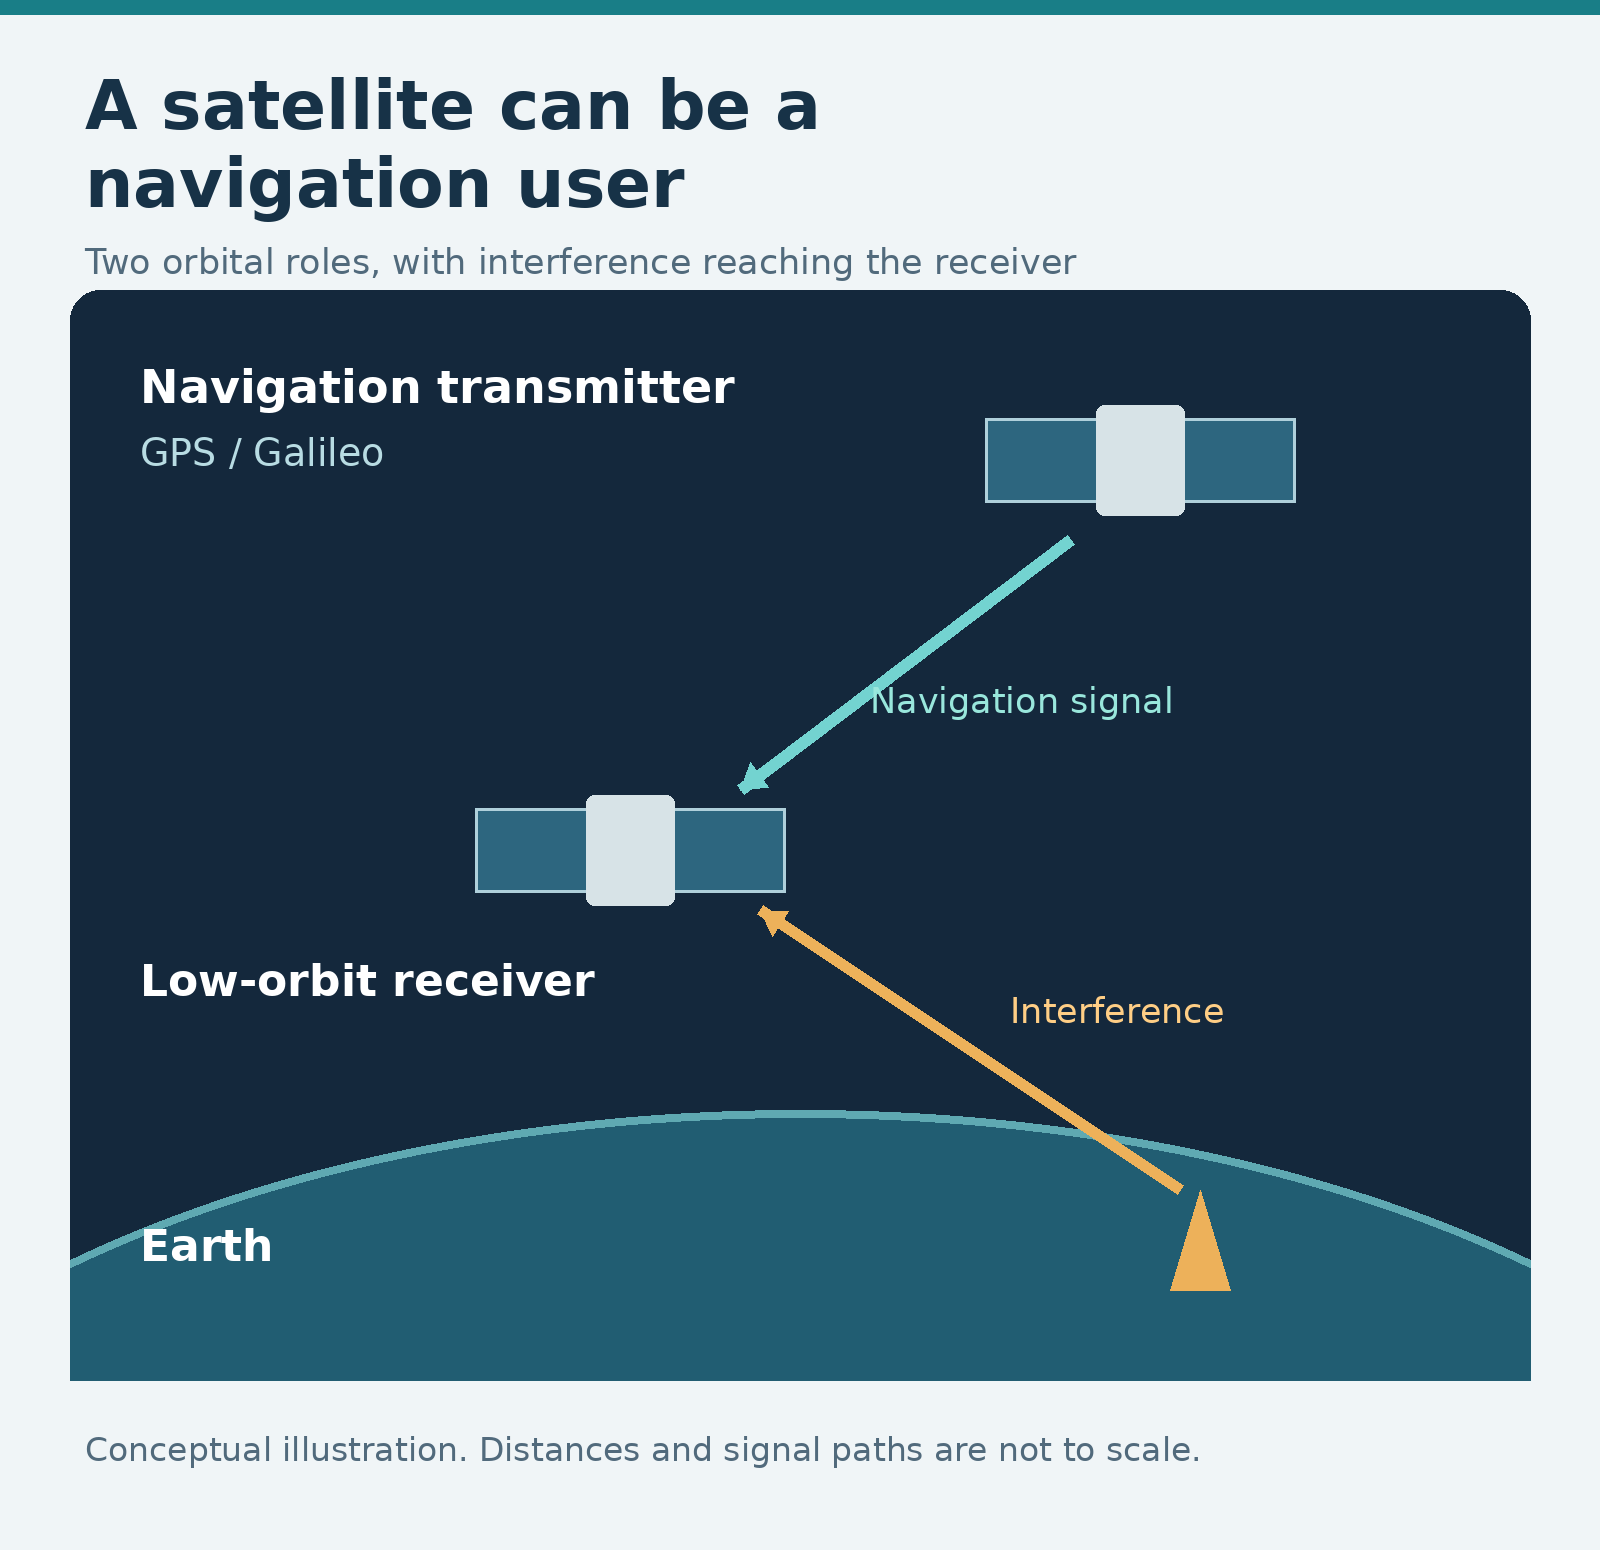
A satellite can be a GNSS user as well as a space asset. The drawing separates the navigation transmitter from the affected receiver; distances are not to scale.
The evidence comes from receivers in orbit
The original conference abstract describes a study using observations from multiple missions, including ESA’s Swarm constellation, Copernicus Sentinel satellites and radio-occultation missions. Examining different platforms helps researchers test whether a pattern is confined to one instrument.
The authors report recurring regional degradation in reception, with some observations lost. They interpret the geographical and temporal patterns as consistent with terrestrial interference sources. That is a finding about the pattern in the measurements, rather than a direct photograph of a transmitter or proof of its operator’s intentions.
The distinction between a received signal and its origin is especially important here. A spacecraft moves through a large volume of space. The point on Earth beneath it is an observation location; it is not automatically the place from which the interference was transmitted.
Space-based measurement also has a history beyond this announcement. A 2024 NASA-hosted research abstract describes using radio-occultation observations to detect and monitor interference. That work uses a different measurement approach, but it helps establish the broader point: navigation problems can leave evidence in spaceborne instruments.
Space weather is a real alternative explanation
A navigation receiver losing a signal is not, on its own, proof of deliberate jamming. Natural processes can also interfere with reception.
The European Space Agency explains that charged particles in the ionosphere, influenced by the Sun, can disrupt or delay GNSS signals. Unwanted emissions from other equipment can create additional problems. A useful investigation has to test those possibilities rather than assign every anomaly to electronic warfare.
A separate study published in GPS Solutions in October examined Swarm observations from 2014 through 2025. Its authors compared navigation losses with plasma-density diagnostics. They found the expected relationship with ionospheric conditions, alongside a regional subset of losses that they concluded was inconsistent with those conditions and aligned with reported human interference.
The studies are not interchangeable tests of one identical dataset. Together, they show why both parts of the investigation matter: demonstrating a reception problem, then examining which explanations fit it.
For a reader, the useful question becomes what a particular method measures and which alternatives it can exclude. A map’s alarming color palette cannot perform that analysis by itself.
SAT-JAM is updated daily, but its observations arrive later
SAT-JAM’s own guide is unusually clear about the difference between an updated website and a live picture.
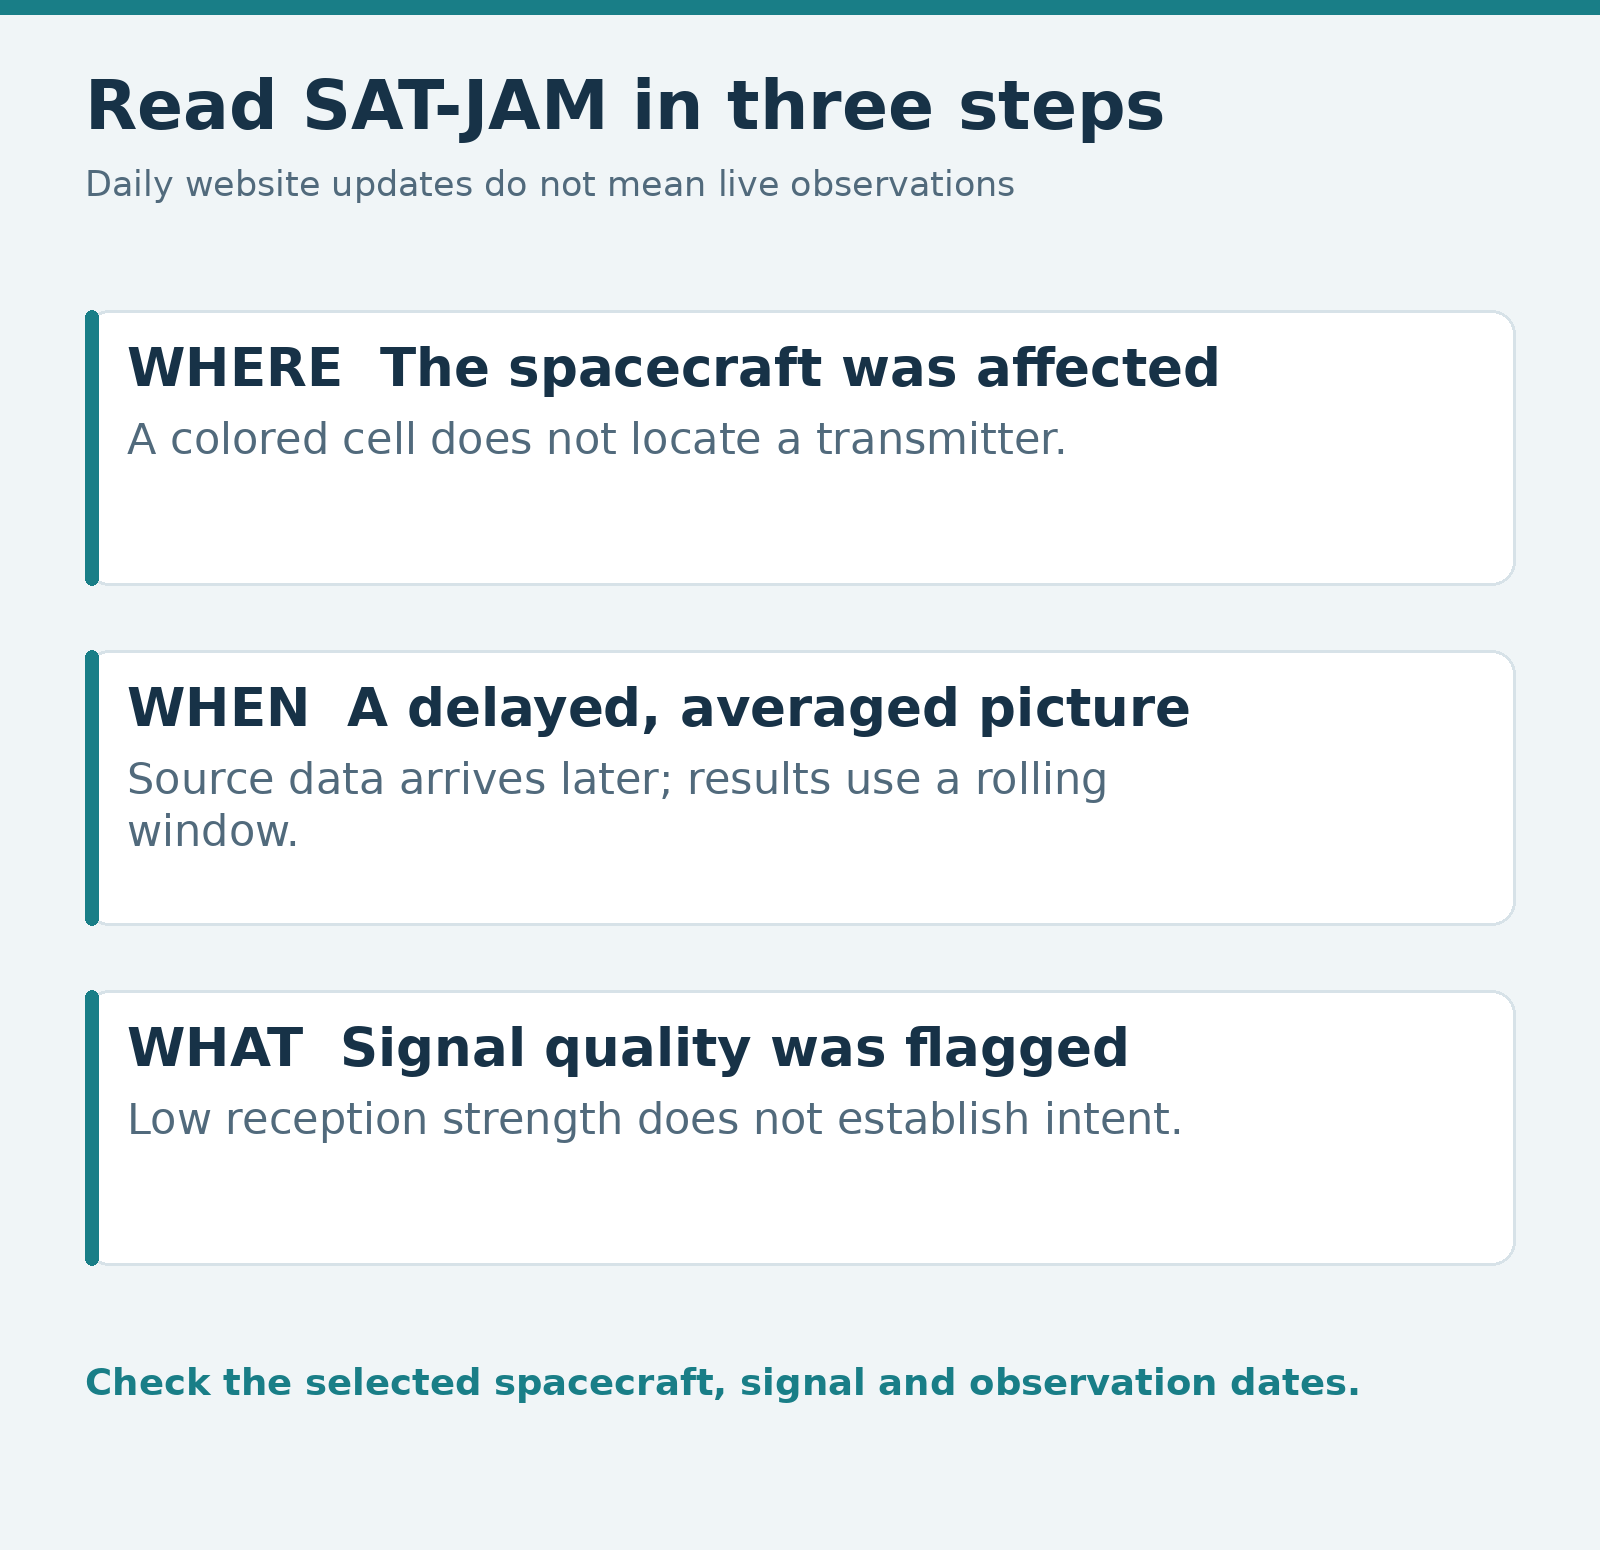
The map uses published satellite observations. Its newest source data is typically one to three weeks old, depending on the spacecraft, and the displayed results are averaged over a rolling period of about six weeks. A daily update can therefore add newly available historical observations to an already averaged picture.
That makes the map useful for examining persistent patterns. It makes a claim about what is happening at this exact moment much harder to justify.
The map also groups observations into large hexagonal cells, roughly 300 kilometers across. A colored cell describes the fraction of relevant observations flagged while the spacecraft was in that area. It does not establish that every place on the ground beneath the cell experienced a navigation problem.
The website’s method flags observations when the carrier-to-noise density ratio—a measure of signal quality—is more than one standard deviation below the global mean. This statistical rule can flag some observations even when no interference is present. Low values should therefore be interpreted as little or no interference, rather than a perfectly clean count of attacks.
Jamming and spoofing leave different clues
The words often travel together, but they describe different problems. Jamming overwhelms a receiver’s ability to use the legitimate signal. Spoofing introduces false signals intended to mislead the receiver about position or time.
That difference affects detection. SAT-JAM is especially sensitive to reductions in received signal quality. Its guide warns that spoofing may escape the method because deceptive signals can be strong rather than weak.
A low-interference display is therefore not a certificate that no manipulation occurred. Equally, a heavily flagged area is not a count of successful spoofing incidents. The measurement has a defined job, and treating it as a detector of every navigation threat would exceed that job.
There is another distinction worth preserving when reading satellite-related headlines: interference transmitted from space and interference affecting receivers in space are different mechanisms. The DTU story concerns reception aboard low-orbit spacecraft. A separate investigation into signals from a satellite should not be folded into it simply because both involve orbit and GPS.
The practical stakes depend on the application
Accurate position information is useful because the spacecraft is doing something with it. DTU points to applications such as locating Earth-observation imagery and positioning communications antennas.
That gives reception problems a plausible route to practical consequences. An instrument’s measurement becomes less useful if its location cannot be established accurately enough for the intended task. A system that needs precise pointing may face a different set of problems.
The route from an affected receiver to a failed service still needs evidence. A temporary loss of observations does not, by itself, tell us how much a product deteriorated, whether an operator compensated for the loss, or whether customers noticed anything at all.
The inspected research establishes reception effects and reasons to care about them. It does not supply a general bill for customer outages, a count of disabled satellites, or proof that a particular image or communications service failed because of one transmitter.
That is where further reporting could add the most value: an operator identifying an actual application effect, explaining how it was detected and distinguishing the problem from what its other systems could accommodate.
The map changes the viewpoint
The interesting development is that a familiar navigation threat can extend into an environment many people assume is beyond its reach. A spacecraft can be far above the aircraft and ships experiencing trouble while still listening for vulnerable navigation signals.
SAT-JAM offers a way to inspect that problem across published observations. Its usefulness grows when readers keep the spacecraft, the measurement period and the selected signal in view.
Before sharing a striking cell, check the dates in the legend and what the receiver was actually measuring. The image may reveal a persistent problem in orbit. The next claims—who caused it, whether it was deliberate and what service was harmed—need evidence of their own.
Sources