
Editorial illustration: delays and dangerous routes can reduce what an expanding tanker fleet actually delivers.
An oil tanker does not have to sink to stop being useful. It can wait for a safe passage, get stuck on the wrong side of a conflict, or spend longer carrying the same cargo.
During the first-quarter disruption, shipowner CMB.TECH reported that 115 very large crude carriers and 24 Suezmax tankers were temporarily removed from effective supply. Those were ships the market could not use normally. A growing fleet offers little comfort to a refinery waiting for its next delivery.
We put the chance of front-month ICE Brent crude futures reaching US$150 a barrel at least once during 2027 at 25%. A brief, valid exchange trade would count. Keeping oil above $150 for months would be a much harder outcome.
Renewed fighting involving Iran is the clearest danger. But the case for a price spike rests on more than another alarming headline. It depends on how many barrels fail to reach buyers, how long that lasts, and how much protection remains when the next shock arrives.
The market has already shown how differently oil can be priced. The International Energy Agency's October report described Brent futures near $107, North Sea Dated near $134, and some physical grades reaching $160. Those were different measures at the report's cutoff. An expensive physical cargo does not mean the futures benchmark has crossed our threshold.
The delivery date matters, too. Brent's October 23 settlement was $116.72. But dated contract quotes put March 2027 near $104 and December 2027 near $87. March is the delivery contract that begins 2027 as the nearest unexpired contract under ICE's expiry schedule.
That leaves a substantial climb to $150. The later prices also reflect a market in which oil for prompt delivery commands a premium. They are prices at which contracts trade, rather than promises about where oil will be next Christmas.
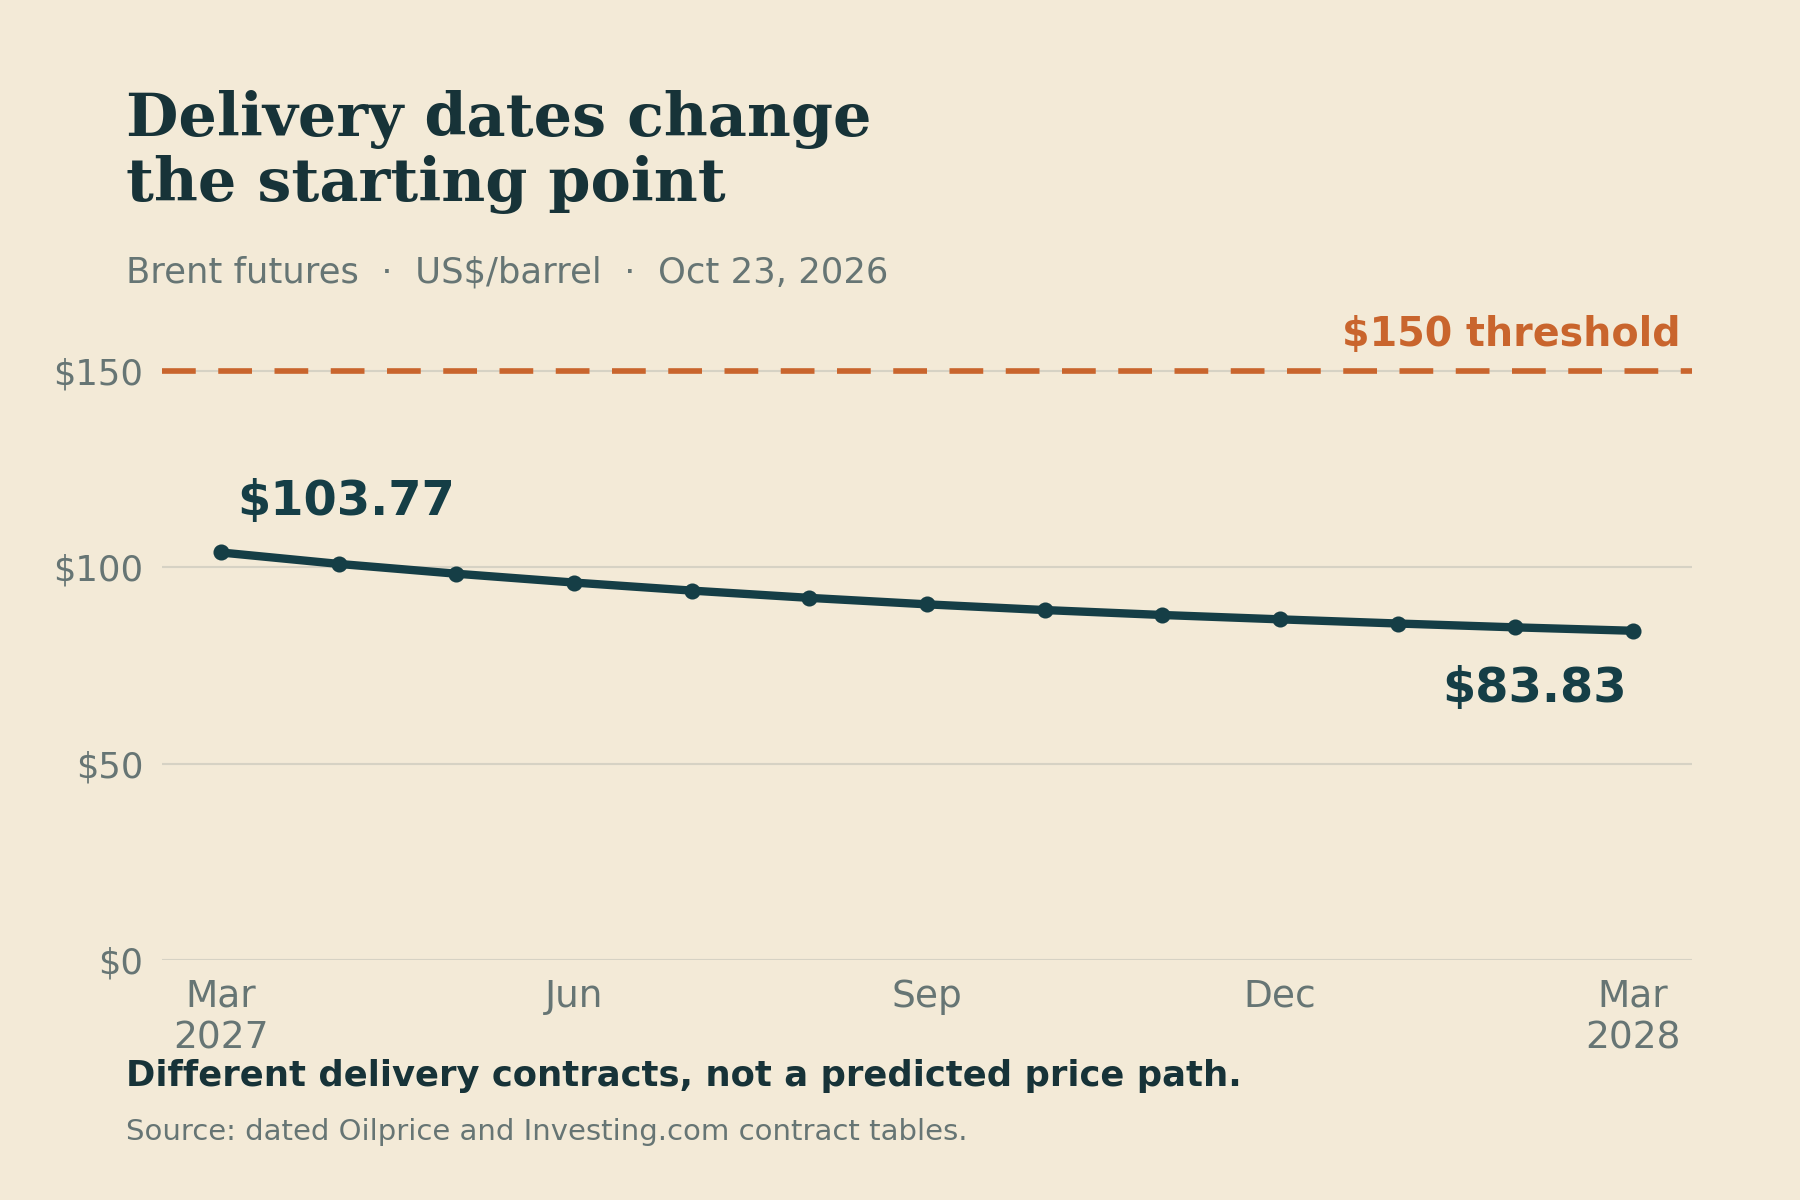
Delivery-contract quotes dated October 23, in US dollars per barrel. These are ordinary futures prices, not probabilities or a forecast price path. Source: public Oilprice and Investing.com contract tables.
The tanker story becomes interesting here. BIMCO's August outlook projects roughly 10% crude-tanker fleet growth between the end of 2025 and the end of 2027. Yet more than 70% of the capacity on order is scheduled for 2028 or later. The shipyard orderbook cannot rush to the rescue on demand.
Even delivered ships need safe routes, willing owners and workable insurance. Older or sanctioned vessels do not provide the same options for every cargo. A voyage that needs extra transfers, waiting time or a longer route uses more of a ship's working life to move each barrel.
Imagine a round trip that stretches from 60 days to 75. Over a 300-day period, the same ship completes four trips instead of five. That is 20% less delivery capacity. Carrying the original amount would require 25% more equivalent ships. These are illustrative assumptions, but the arithmetic explains why counting hulls misses part of the problem.
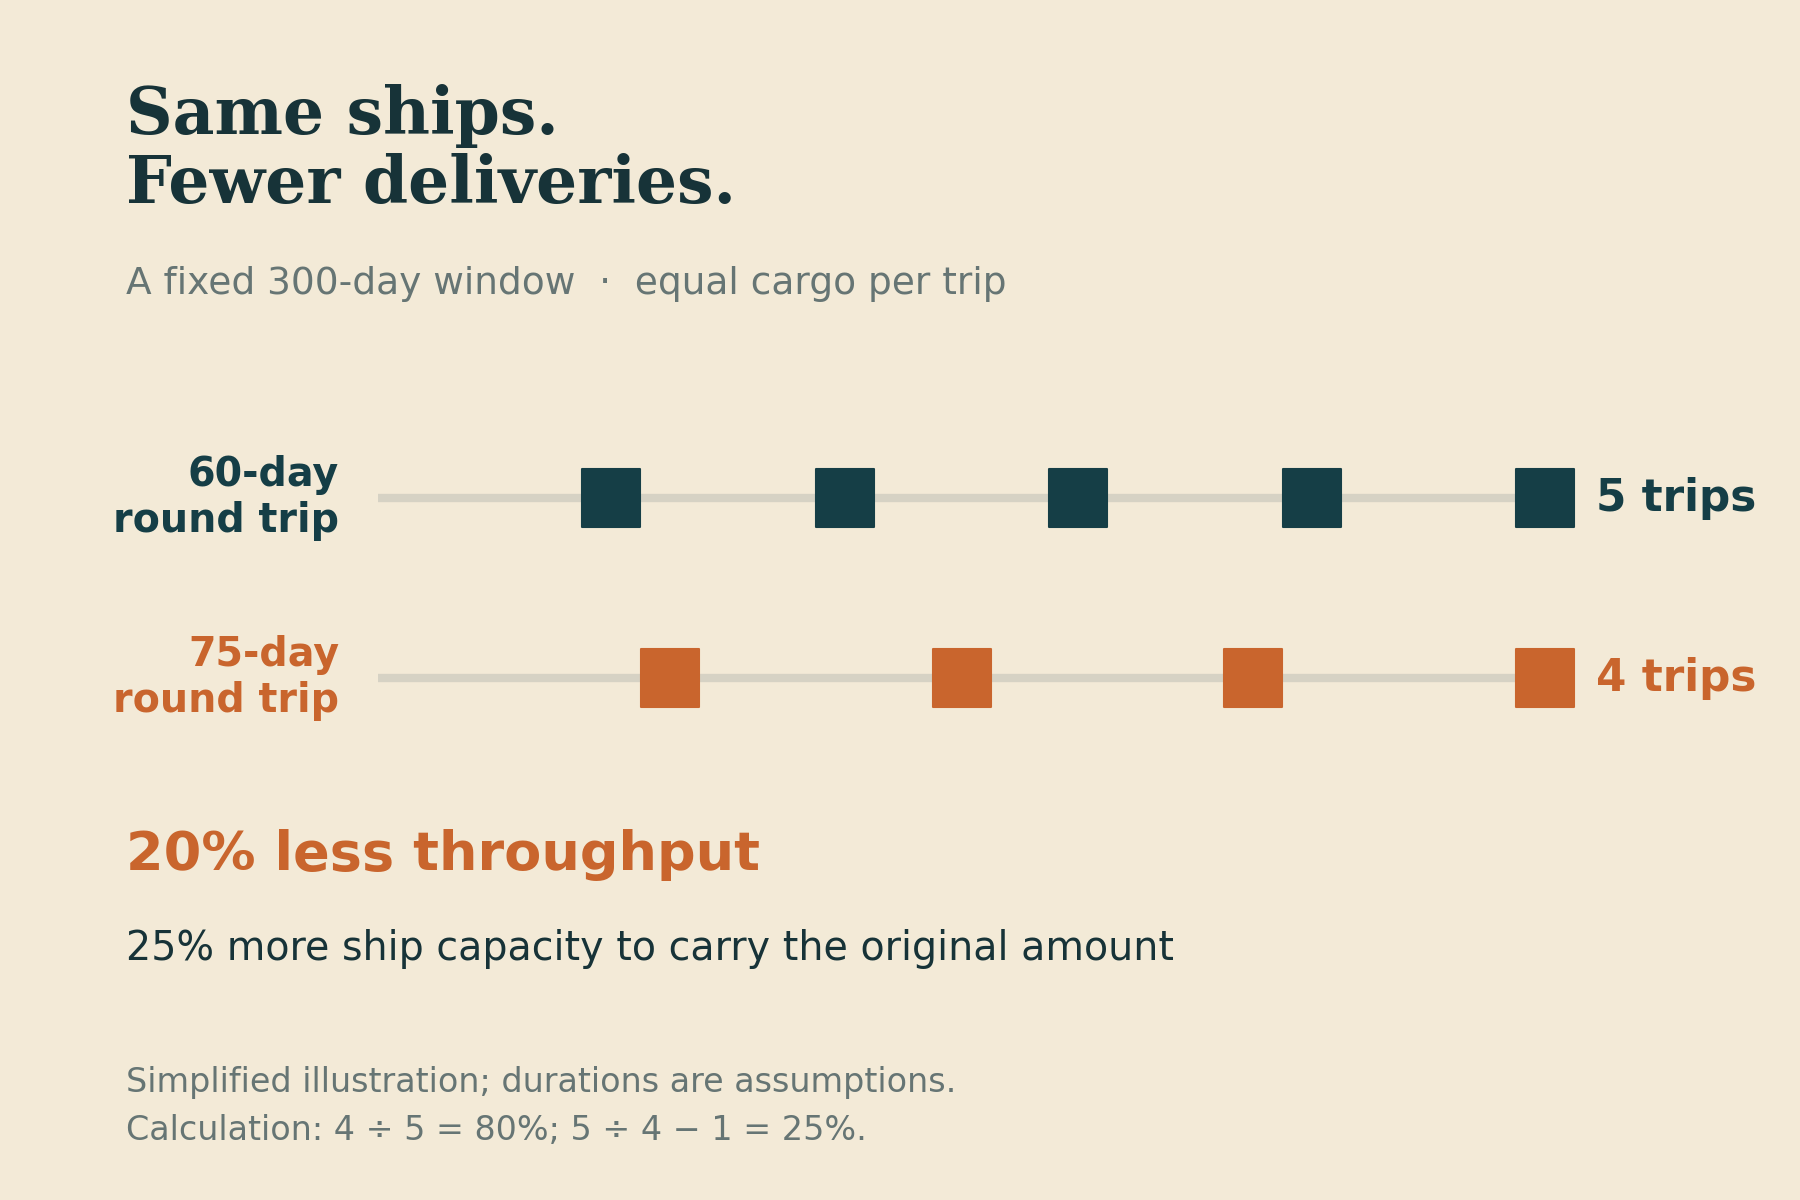
Illustration, not an observed route average: equal cargo per trip and unchanged fleet size. Longer round trips reduce deliveries even when no ships are lost.
There is a catch. If Gulf exports stop, there are also fewer cargoes to carry. Ships outside the danger zone can end up competing for work. CMB.TECH's report described both temporarily unavailable vessels and later pressure from ships repositioning into the Atlantic. It also warned that some spectacular freight assessments were largely indicative when few actual Gulf fixtures took place.
Oil can become scarce while some tanker owners struggle to find cargo. The shortage is a failure to match usable ships, accessible oil and buyers at the right time.
The next layer of protection is storage. In September, the IEA recorded a 113-million-barrel decline in on-land inventories, largely offset by 103 million more barrels on water. Total observed stocks were still 509 million barrels below their end-February level. A barrel at sea can be perfectly usable, but its arrival date matters to the refinery that needs it.
That makes a renewed disruption dangerous even if its initial scale is smaller than an earlier one. The market could enter it with less oil conveniently placed to absorb the blow. A worse price outcome would not require every military measure of the conflict to be worse.
For scale, a net shortage of 3 million barrels a day lasting a month consumes 90 million barrels of protection. Three months takes 270 million. Here, “net” means after replacement supply, usable bypass routes, reserve deliveries and lower consumption. Counting every interrupted Gulf barrel as a global shortage would exaggerate the damage.
In a severe Middle East scenario, around $200 a barrel is a credible stress reference. In a May scenario analysis, Wood Mackenzie modeled Brent approaching that level by the end of 2026 if Hormuz remained largely closed and more than 11 million barrels a day of crude and condensate stayed shut in. Inventories kept falling even as demand dropped sharply.
That was a dated scenario for 2026. Our judgment is that renewed, prolonged losses of deliverable oil in 2027 could create pressure of a similar order, especially if attacks also impaired the routes built to bypass Hormuz. Around $200 is a severe-case yardstick, rather than a maximum or our expected price.
Wood Mackenzie's separate figure near $300 concerned diesel and jet fuel. Those products have their own refinery bottlenecks. Confusing them with crude would inflate the story. Consumers and businesses can face a severe fuel shock before Brent reaches the same price.
The route to the worst case runs through time: repeated damage, slow repairs, shrinking stocks and exporters unable to restore dependable deliveries. High prices then force adjustment through cancelled trips, reduced factory output and squeezed household budgets. Oil can become painfully expensive while the economy is already weakening.
The pressure would travel through ordinary bills. A delivery business with fixed customer prices might have to absorb higher diesel costs. An airline could cut routes or raise fares. A household that needs the car for work has fewer easy ways to avoid another fuel increase. These are different exposures to the same disruption, and their costs would depend on how long it lasted.
That is why a price spike and a lasting economic shock deserve separate attention. A single $150 trade would settle our forecast, but months of expensive crude and refined fuels would do much more damage. The worst case is a delivery problem that keeps renewing itself while the available buffers get smaller.
There is also a serious route away from $150. The EIA's October outlook assumes workarounds improve and most regional production returns by the end of the second quarter of 2027. Its projected annual Brent spot average is $84. An annual average cannot rule out a brief spike, but the recovery behind that forecast deserves weight.
Repairs are more than a theory. Saudi pipeline flows have partly resumed, and Yanbu loadings have restarted. Abu Dhabi has announced a new pipeline with a 2027 operating target intended to double ADNOC's export capacity through Fujairah, outside Hormuz. Completion and usable throughput still matter, but the project offers a concrete way to reduce dependence on the strait.
Emergency stocks provide another bridge. By October 15, the IEA said roughly 330 million barrels had been released, with about 100 million still planned under its March action. That remaining commitment is not the world's entire reserve, and it cannot all arrive at once. It can still buy time for repairs.
The accounting matters. Oil already moving through a bypass cannot also be counted as unused rescue capacity. A reserve release can already appear in a reported stock draw. And restoring an export route can help twice: more cargo reaches buyers while ships spend less time waiting or making awkward transfers. Those connections can turn the same system toward recovery.
These opposing forces explain our one-in-four estimate. Historical daily physical Brent prices show that large rises happen: in the denser 2007–2025 data, six of 19 years had an observed maximum at least 45% above the first daily close. That is useful context for the scale of the climb, with important differences from an intraday futures trade.
Our price-path tests then asked how recovery speed, volatility and the persistence of shocks changed the result. Different assumptions produced illustrative odds of roughly 10–50%; that is not a confidence interval. We settle at 25% because depleted buffers and continuing disruption make the risk substantial, while lower deferred prices and several credible recovery routes make a miss more likely.
The decisive signs will be sustained deliveries and rebuilding stocks. A ceasefire that allows ships and pipelines to work reliably would weaken the case for $150. Fresh damage that keeps oil from reaching buyers for months would strengthen it.
The next dramatic announcement will attract attention. The barrels arriving after it will decide the price.