
Oil could reach a frightening price for more than one reason. A brief surge driven by fear, a prolonged shortage of exportable crude and a disruption to refined fuels would be different events, even if all three produced a dramatic number on a screen.
The useful question behind $150 or $200 oil is therefore what would have to fail, for how long, after allowing for the damage and disruption already present. Those levels are conditional stress cases here, not GripRoom price forecasts.
As a dated reference point, Reuters reported a November 5 Brent futures settlement of $98.29 a barrel. Reaching $150 from that level would add $51.71, or about 52.6 percent. Reaching $200 would add $101.71, or about 103.5 percent. The arithmetic describes the size of a move. It says nothing about the probability that the move will occur.
The old $150 case has an old date
One widely circulated high-price scenario comes from a Wood Mackenzie release published on March 10, 2026. It tied its stress analysis to a large Gulf supply shutdown and the price response needed to reduce demand. Its extreme discussion included $150 and $200 possibilities under severe conditions.
That is an identifiable analysis with identifiable assumptions. It is not a fresh November forecast. Copying a March estimate of lost supply into a November article would make an old scenario look like a current measurement.
The scenario remains useful for a narrower reason: it shows how sustained loss of physical supply can force buyers to compete for fewer available barrels. The size and duration of the actual shortfall still have to be established for the period under discussion. A price target without those conditions is a headline looking for a model.
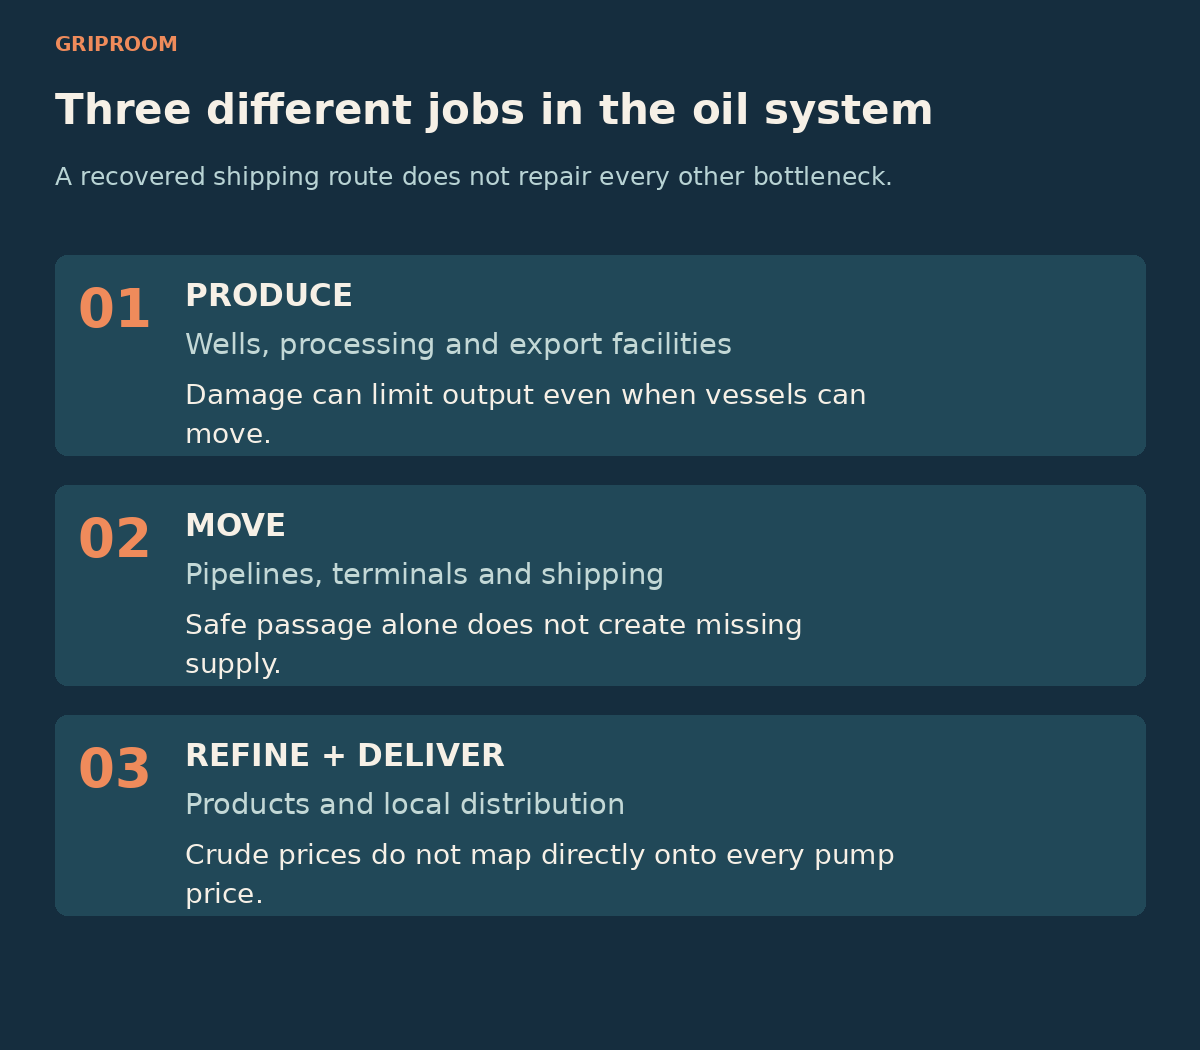
Oil must be produced, moved and converted into usable products. A route can reopen while production remains damaged; output can recover while transport remains constrained. Refining and distribution add separate local conditions. The diagram describes dependencies, not a forecast that every stage fails.
Moving oil and producing oil are different problems
A shipping interruption affects the ability to move a cargo. Damage to production, processing or export infrastructure can affect whether that cargo is available to move. Repairing one bottleneck does not necessarily repair the other.
This is why a reopening headline can be encouraging without meaning that supply has returned to normal. A vessel may be able to pass while an upstream facility still needs repairs. Conversely, production may be technically available while safe transport or export arrangements remain constrained. These are dependencies, not a forecast that every part of the system will fail together.
They also create a counting problem. If a barrel cannot be exported because its production has already stopped, it should not be counted again as an additional barrel lost to shipping. The relevant quantity is the net supply unavailable to buyers, compared with a clearly stated baseline.
The baseline matters particularly during an existing conflict. A calculation starting with normal prewar traffic answers a different question from a calculation about a further loss from already reduced flows. Mixing those starting points can inflate an apparently precise estimate.
September data cannot measure November by themselves
The EIA’s October outlook describes September disruptions, including damage to a bypass pipeline and a partial resumption after repairs. The IEA’s October market summary also reports September conditions, including Hormuz movements and Gulf exports. Their different quantities and definitions must be kept separate.
Those reports are valuable evidence about the system’s condition and its recovery constraints. Neither is a comprehensive live November 5 balance. An outlook’s release date is not the observation date of every number inside it.
The same caution applies to prices. A physical crude assessment, a particular grade and a Brent futures settlement are different measures. An unusually expensive physical cargo cannot simply replace the futures baseline in a comparison without explanation.
Readers should be skeptical of claims that combine the newest timestamp on a webpage with the largest historical flow number in its tables. The date of the table, the unit and the thing being measured all need to travel with the number.
Duration decides how far the shock travels
A disruption lasting hours presents a different adjustment problem from one lasting weeks or months. Buyers can react to a temporary interruption without knowing whether it will persist. A durable shortage gives inventories and substitution less room to absorb the loss.
For a sustained high-price argument, several questions need answers: how much additional supply is unavailable, which facilities or routes constrain recovery, how much alternative capacity is usable, and how quickly consumption can adjust. The word “capacity” is doing important work. Capacity on paper is not automatically capacity available immediately under the conditions of the crisis.
Braemar’s November shipping analysis distinguishes continuing inefficient movement, sustained cargo loss and recovery scenarios. That helps explain why normal passage, normal cargo availability and normal shipping efficiency need not return on the same day. It does not establish which path will occur.
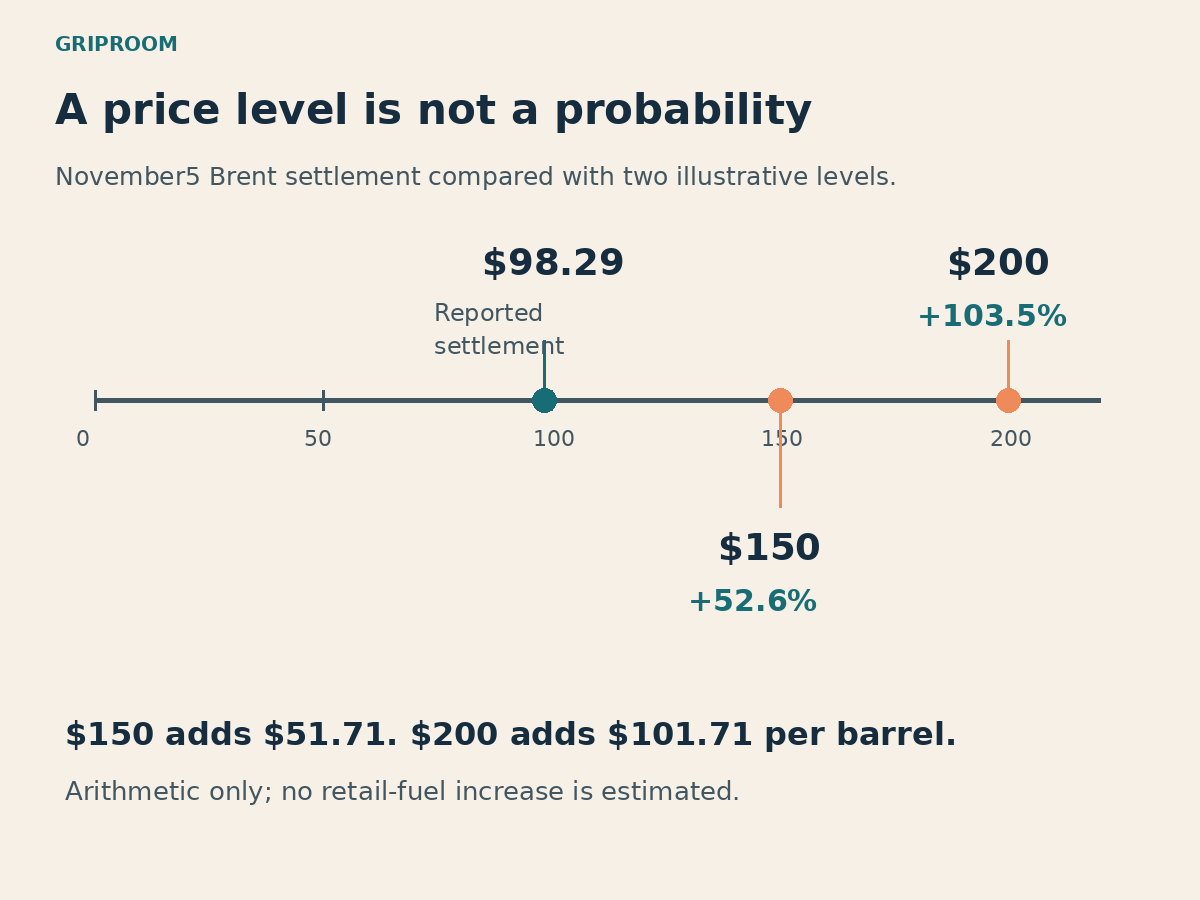
Reuters reported a November 5 Brent futures settlement of $98.29 per barrel. A $150 level is $51.71, or 52.6 percent, higher. A $200 level is $101.71, or 103.5 percent, higher. These are arithmetic comparisons; they do not estimate a scenario’s probability, duration or local gasoline-price effect.
The buffers are real, but they are not magic
The IEA identifies emergency stock releases and demand restraint as response tools. They can help bridge a disruption. They cannot rebuild a damaged facility merely by existing in an emergency plan.
The often repeated 90-day stock obligation also needs its denominator: it concerns net imports for the members subject to it, with exemptions for net exporters. It is not a guarantee that the world has 90 days of ordinary consumption available without difficulty.
Repair and market response can matter quickly. A Congressional Research Service account of the September 2019 Saudi attacks describes an initial loss of 5.7 million barrels a day and an oil-price jump followed by a pullback. That history is a reminder to examine restoration and response. It is not a formula for the size or duration of a 2026 shock.
The strongest countercase to sustained $200 oil is therefore more specific than optimism. It includes limited rather than expanding damage, usable alternative movement, effective repairs, available inventories, reduced consumption and a political outcome that prevents another round of losses. Each needs evidence before being assigned a size.
A barrel price is not a household bill
Gasoline and diesel require refining and distribution. Local supply conditions and the structure of the retail price also matter. A percentage change in crude cannot be applied mechanically to every household’s fuel spending.
The crude calculation above holds the unit constant: dollars per barrel compared with dollars per barrel. A household calculation would need a different chain of assumptions, including how wholesale changes reach the product being bought and how much of that product the household uses.
This is where a useful energy article earns its space. It should explain which constraint could become binding and what would relieve it, rather than attach the largest available number to an unspecified worst case.
The companion guide to retaliation and wider consequences maps the possible transmission paths. For oil itself, watch net new losses, duration, recoverable capacity and the response. Those variables can support a defensible stress case. A dramatic price level alone cannot.