Melting Greenland’s land ice adds water to the ocean. Yet near the ice sheet, the sea can fall relative to the coast, even as the global average rises. The apparent contradiction comes from treating the ocean like a bathtub with a fixed floor. Greenland’s floor moves, and its enormous mass helps shape the water above it.
As the ice shrinks, its gravitational attraction weakens and nearby seawater redistributes. Meanwhile, the land rises as some of the weight pressing it down disappears. Both changes can lower the waterline measured against the shore.
That creates an unexpectedly awkward climate problem. A community can face a warming world and a shallower harbor at the same time. Less water over a submerged rock is not much consolation for avoiding a higher tide line.
The coastline is part of the measuring stick
“Sea level” sounds like one number. For a coastal community, the useful number is usually relative sea level: the height of the water compared with the local land. A tide gauge attached to a coast experiences the coast’s movement, too.
Scientists can also measure sea-surface height against an Earth-centered reference. That is often called absolute or geocentric sea level. As the US sea-level portal explains, the distinction matters because land can rise or sink. A local absolute measurement is not automatically the global average, either.
The accounting is simple: relative sea-level change equals the change in the sea surface minus the change in the land. Raise the land while holding the water steady, and the waterline falls against the shore. Lower the water while holding the land steady, and it falls again. Near Greenland, both effects can work together.
The added meltwater has not vanished. Its global contribution and the local shoreline response describe different parts of the same physical system.
This also explains why a falling waterline cannot, by itself, tell an observer how much the ground has risen. The ocean surface may have changed at the same time. To separate the contributions, researchers need a common reference and observations of land motion, alongside information about the water.
An ice sheet has pull as well as weight
An ice sheet is massive enough to attract nearby seawater gravitationally. Its contribution helps make the ocean surface higher nearby than it would otherwise be. Lose some of that ice, and the attraction weakens. Water redistributes away from the shrinking mass, lowering the nearby surface.
The solid Earth also responds to unloading. Some motion is relatively immediate and elastic. Another part unfolds more slowly as material deep inside the Earth deforms. The coast carries a memory of older ice changes, including losses long before the current century.
These processes are established physics. NASA described the Greenland paradox in 2020, explaining why sea-level change has a geographic “fingerprint.” Changing ice and ocean mass also changes Earth’s shape and slightly shifts its rotational axis, further complicating the pattern.
The fingerprints differ according to where ice disappears. Melt Greenland, and the response differs from melting Antarctica or another glacier system. The important ingredient here is ice resting on land, not simply floating sea ice melting where it already displaces seawater.
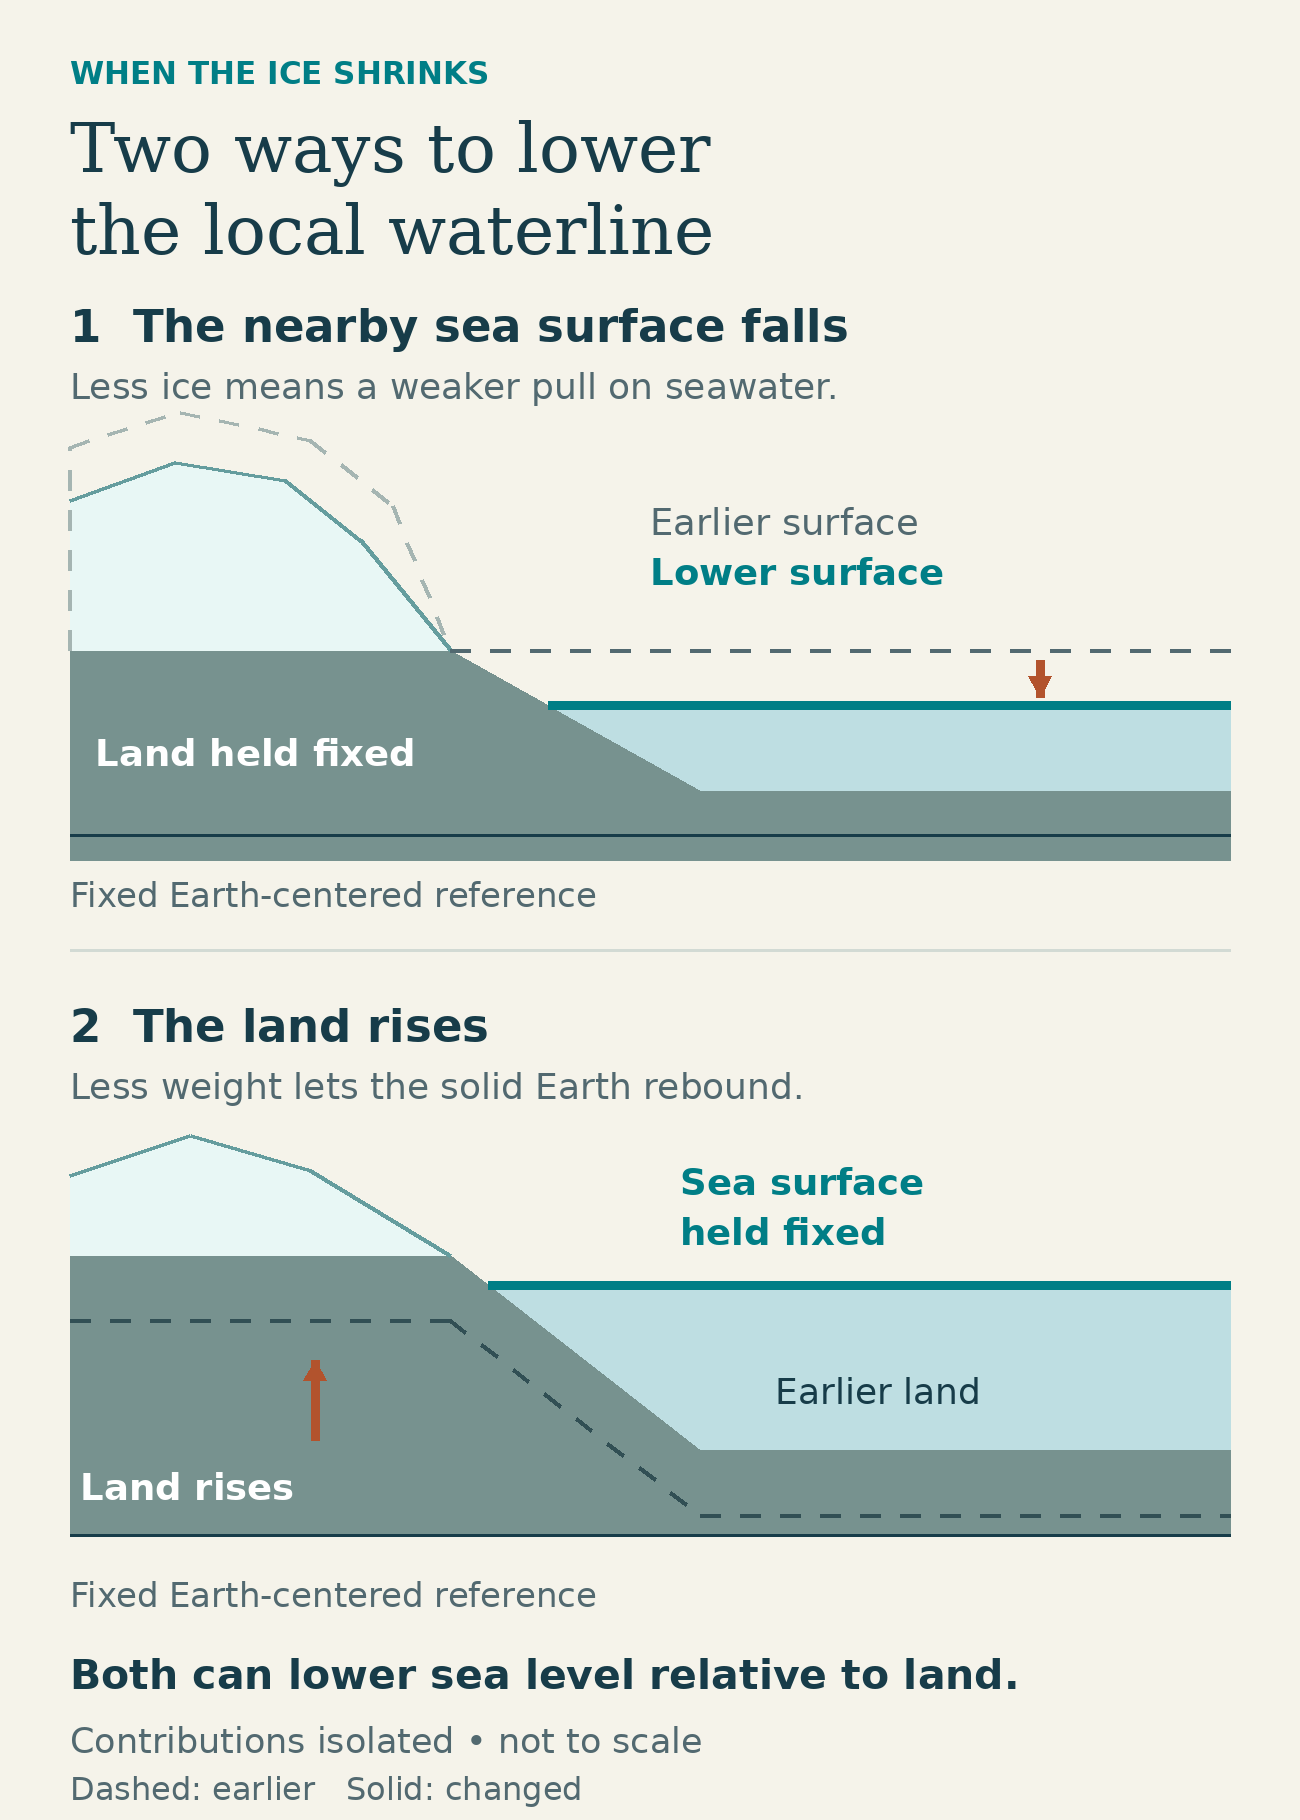
Two contributions, shown separately for clarity. Dashed lines mark earlier positions; solid lines show changed positions. Schematic, not to scale and not a prediction of equal contributions.
In the upper cross-section, the land is held fixed to isolate the effect of a lower sea surface. In the lower one, the water is held fixed to isolate rising land. Real coastal change combines both with other influences; the shared reference is fixed, rather than attached to the moving shore.
What the 2026 study added
A study published in Nature Communications on January 20, 2026, led by Lauren Lewright, put more regional detail around that explanation. It projected Greenland’s coastal relative sea level in 2100 compared with 2017 under two emissions pathways: low-emissions RCP 2.6 and high-emissions RCP 8.5.
The team combined evidence about past sea levels with modern measurements of land motion and simulations of future ice loss. It used 55 stations from Greenland’s 57-station satellite-navigation network. Two stations near Kangerlussuaq were excluded because the selected model could not adequately represent the unusually weak mantle behavior there.
Ancient shorelines and modern instruments supply different clues. Geological evidence helps constrain the slower response to old ice loads, while satellite-navigation records capture recent movement. The challenge is to make a model that respects both histories, rather than assuming the Earth reacts identically over decades and thousands of years.
Those instruments observe how the land moves today. They do not measure where the sea will be in 2100. The century-end results come from models constrained by those observations, including ice projections from eight modeling groups and additional contributions from ocean and climate processes.
Both scenarios produce falling relative sea level at the six settlements the researchers examined. Their trajectories separate more clearly around mid-century. The high-emissions case is a conditional comparison, not a declaration that this pathway is inevitable or the most probable future.
Nuuk and Tasiilaq do not get the same number
The study’s supplement provides town-specific projections. In Nuuk, on the southwest coast, the median projected fall by 2100 relative to 2017 is 0.35 meters under RCP 2.6, with a likely range of 0.15–0.55 meters. Under RCP 8.5, it is 0.83 meters, with a range of 0.54–1.20 meters.
For Tasiilaq in southeast Greenland, the corresponding median falls are 0.58 meters under RCP 2.6 and 1.40 meters under RCP 8.5. Their likely ranges are 0.38–0.83 meters and 0.95–1.80 meters, respectively, again comparing 2100 with 2017.
Here, “likely” means the 17th–83rd percentiles of the modeled distribution. Those intervals describe uncertainty within each scenario. They are neither 95% confidence intervals nor probabilities that the world will follow one emissions pathway.
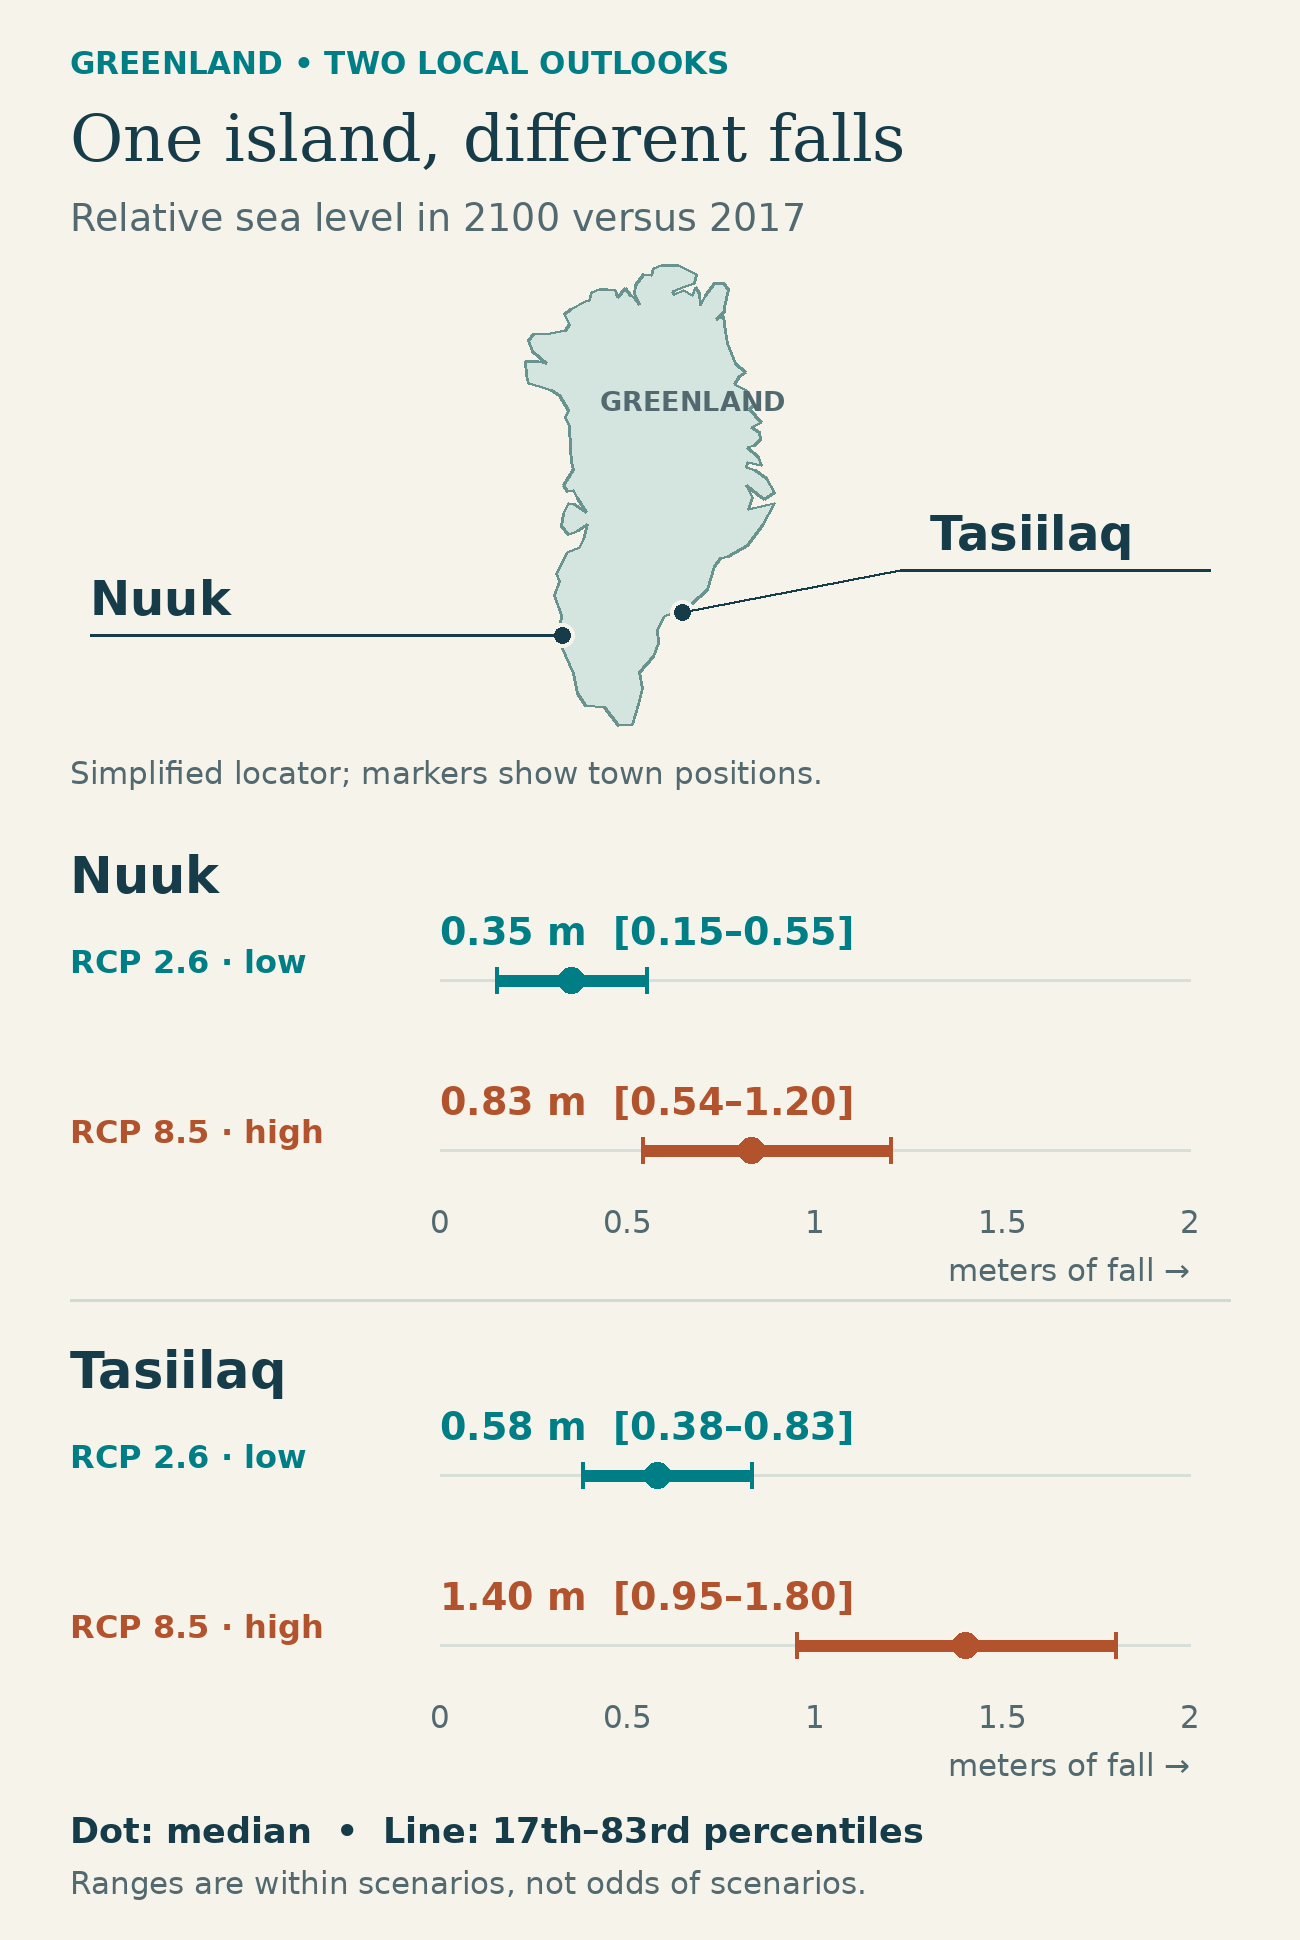
Projected falls in 2100 relative to 2017, in meters. Dots mark medians; lines mark 17th–83rd percentile ranges. Positive numbers here mean the amount of fall, not rising sea level. Locator geography: Natural Earth; projections: Lewright and colleagues, supplementary Section 2.
The comparison shows both differences at once: the emissions pathway changes the result within each town, and the location changes it within each pathway. A single number cannot stand in for the whole coastline.
That is especially important for the striking 2.5-meter figure associated with the study. It is the largest coastal median fall in the high-emissions scenario, near Helheim Glacier. The low-emissions maximum is 0.9 meters near Sermeq Kujalleq. These are different places, both measured in 2100 against 2017. Neither number is a Greenland-wide average, and neither measures land uplift alone.
A lower sea can leave a boat with less room
Flooding is the familiar coastal hazard. Falling relative sea level creates another: reduced water depth over the seabed. A rock that once had comfortable clearance can become an obstacle. A shallow channel can become harder to use at low tide, and changes around narrow passages can affect circulation.
A June 1, 2026 study led by Kirsty Tinto brought that problem to community-guided mapping around Aasiaat in western Greenland. Local partners helped identify important harbors, fishing and hunting areas, and channels, including Ikerasannguaq and Nivaaq. The researchers combined detailed seafloor mapping with the sea-level projections to examine where future changes could matter.
The danger is partly about thresholds. A modest change in water depth can have a disproportionate effect where a passage is already shallow. A broad average cannot identify every such bottleneck; the shape of the seabed matters.
This later paper applies the earlier projection framework, rather than independently reproducing its climate results. Its future access concerns are conditional, not reports that the channels have already closed. The mapped seafloor has uncertainty, and future changes in tidal elevations were not modeled. Actual navigability requires local assessment.
The moving Earth still leaves uncertainties
Several influences push in the opposite direction. Thermal expansion and ocean dynamics generally add to sea level around Greenland. The lingering response to ancient ice-sheet changes can raise relative sea level in western and southeastern Greenland while lowering it in the northeast. The final result is the balance of these effects.
Some of that older response comes from the former Laurentide ice sheet in North America. Land around the edges of a heavy ice load can bulge upward; as the Earth readjusts after the ice disappears, that bulge can collapse. Greenland’s shoreline therefore responds to more than the ice immediately beside it.
The January study’s treatment of land motion produces regional results that differ from the IPCC’s broader projections. That is a refinement of local modeling. The IPCC framework already includes gravity, rotation and deformation; this is no discovery that global assessments forgot gravity.
Important uncertainties remain in the Earth’s response, local underground structure and future glacier behavior. Matching present-day land motion cannot certify a century-end water level. Nor does a long-term fall eliminate high tides, waves or storm surges.
The researchers modeled older loading with three-dimensional Earth structures, but simplified the more recent response to properties varying with depth. That makes the calculations manageable while leaving out some local variation. Near a large glacier, uncertainty about how much ice that glacier will lose can also widen the projected sea-level range.
Lower water and a rising bed could also help stabilize some glaciers that end in the sea, but the strength of that feedback in Greenland still needs coupled ice-and-Earth modeling. It offers no established rescue for the ice sheet.
For coastal communities, the lesson is practical: the global average tells only part of the story. A harbor’s future depends on the distance between water and rock. Both can move.